
The price of a Bitcoin graph says much of the future of bitcoin as a potential currency. Its past says much at the same time, that bitcoin has been one of the most volatile trading ‘currencies’. Since 2010, the price of a bitcoin graph has increased and crushed in a single year or through the years.
The price of a bitcoin graph fluctuation actually doesn’t seem to baffle many investors and enthusiasts about the potential of the cryptocurrency. In fact, for many, it is a way to replace the traditional banking system and periodical financial collapse and uncertainty in the centralized banking system. Despite its volatility, the bitcoin price is surging and breaking the $50k mark in 2021.
Since the introduction of bitcoin, the price of a bitcoin graph has been increasing and decreasing, indicating volatility of the currency. It also went through bubbles in a short time.

What is a bitcoin?
Bitcoin is a currency for some, a commodity for others. But let’s agree on the idea of cash or digital cash. This is probably similar to the current cashing system but this one not controlled by a central body. Miner is responsible to find transactions and report them to the chain. NO one has control over the network and more secure than ever. Even no one knows who owns what, except what was sent and received. The account has long numbers representing an individual.
The price of bitcoin is increasing through out the years and in march of 2021 it sits at $55k.
Price of a Bitcoin Graph
Despite the frauds, the bubbles, the volatility of the bitcoin the price of a bitcoin graph seems to point upwards. However, the bubbles i the market is easily noticeable when in 2011 bitcoin jumps from a single dollar to 32 dollars only in a single month. Then the price steadily dropped to $2 only in the next three months.

Then in 2013 the price of a bitcoin graph web through at least two noticeable bubbles. The price began at $13.4 then went up to $220 in 4 months, then went down to $70 the same month in April. THe price nearly doubled at the end of the same year.
Another big change in a price of a bitcoin graph happened in 2017, where the price of bitcoin began at $1k. Soon the price began sinking few dollars before it ends the year with an amazing increase to $20,089.
By 2019 the price of a bitcoin graph surpassed the $10k mark before it fell under that at the end of the same year. Following the pandemic, the price seemed to gain interest. Many have feared the economic crisis and the challenges that the world is facing. At this time, the price increased up to $18k.
The pandemic made it clear that the dollar has a lower buying value, and even the stimulus check the people in the US received was not more than simple cash to cover certain individual problems. Not only that, big companies and stores also joined the rush to use the coin.
In 2020 the price of a bitcoin graph surpassed the 20k mark, and in December the price got to $24,000. At the beginning of 2021, the price of a bitcoin graph increased to a huge amount of $40,000, then to $41,528 in few days before it went down to $30,525 only three days later.

Price of a Bitcoin Graph: Analysis
At the beginning of the bitcoin years, the liquidity of the currency was rather thin with few enthusiasts. Ban on the bitcoin was oe of the first events that incluenced the growth of the price of a bitcoin graph.
Another major event is the Mt. Gox event, the pioneer of the world’s first crypto exchanges. Bitcoins were hacked at the exchanged leaving place for the decline of the value of the currency as much as a quarter of its value prior to the exchange.
The event that affected the price of a bitcoin graph in 2014 was the interest of online retailers to use bitcoin as part of their transaction. This broke the $1k mark.
After half of 2016 and 2017, bitcoin got a considerable amount of mainstream attention. Following the regulations developed in that period, the price of a bitcoin graph has seen an increase and decrease in value as well. Companies such as Tesla, and BMW decided to join the race, and even bought billions of worth of bitcoins for exchange.
The announcement of the launch of Bitcoin at the Chicago Mercantile Exchange and at the CBOE options exchange in 2017 also contributed to the price of a bitcoin graph.
Bitcoin halving is another event that has contributed to the price of a bitcoin graph. Halving events have brought a large price gain around the years. Although the number of miners has been describing due to lower and lower amount of mining rewards, until recently in 2020 where the event saw a bit increase in the number of miners.
How Much Does a Bitcoin Cost Right now?
Bitcoin has passed the $50,000 mark in 2021 and it is gaining momentum. In march, the price of bitcoin is near $55,000

What will bitcoin be worth in 2023?
The bitcoin worth in increasing even in the mid of the pandemic. Following the curve that the price of the a bitcoin graph took in the last few years, the bitcoin worth in 2023 will be between $90k and 150k.
Max Keiser, a financial analyst and host at Keiser Report had predicted the potential of price of a bitcoin graph to $100k in short term and $400k in long term. He even thinks that bitcoin would double in the price of 2021, in nearly eight years. Robert Kiyosaki, Entrepreneur, Investors, and Best-Selling Author, has said that bitcoin would reach $75k in 2023. He is an advocate of gold and bitcoin.
What will bitcoin be worth in 2040?
It is hard to estimate the exact worth of bitcoin in 2040. The volatility of the currency is main factor. At the same time, the acceptance of the currency in various sectors brought a better value for bitcoin.
We can predict bitcoin be worth in 2040 near a million or more dollars.
What was the highest price for 1 Bitcoin?
Bitcoin’s price reached a new record high of almost $50,000, as major Fortune 500 companies showed support for digital currencies. Feb 15, 2021. Bitcoin also has seen a worth of $60k the same year before it went down to $55k in march 2021.
How do I monitor BTC pricing?
Various platforms are dedicated to cryptocurrency, and they give a price of bitcoin graph and related info for the everyday user. Most of the websites that show BTC pricing have a fair amount of information including the price of bitcoin, volume, news, community links, and even avises whether to buy or sell. Some have a guide on how to view the currency and in what activity you need to engage in to make a profit in your investment. If you pay more, you will get a more detailed analysis of the market. Here are some of the platforms where you can see the latest BTC pricing.

coinmarketcap – Well many sites show you the price of the bitcoin graph and much more. What makes coin market cap is its presentation of the historical data and its links to the community and other important destinations.
Visit coinmarketcap
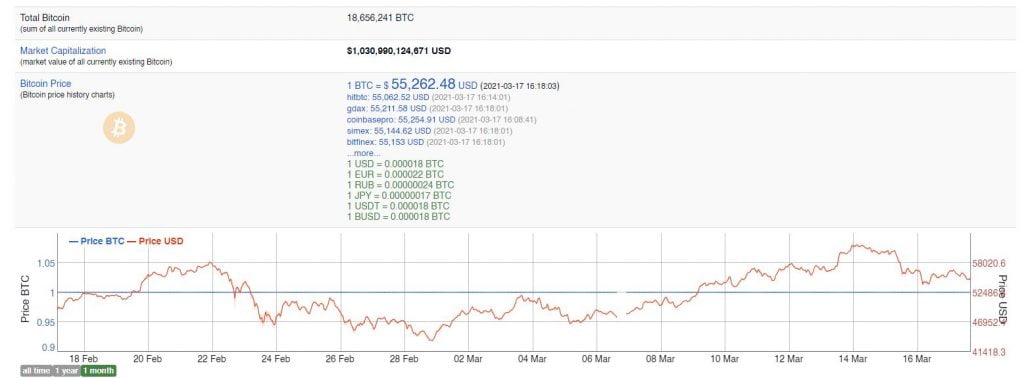
bitinfocharts is one of the most valuable websites under the bitcoin category. The website gives you a simple analysis and data on the price of the bitcoin graph, volume, transaction value, block size, hash rate, profitability. Find prices in your currency, market capitalization, and total bitcoin.
Visit bitinfocharts

messari – If you are looking to check the worth of bitcoin, see graphs, compare prices, and news about the cryptocurrency, then messari is another alternative in the market. With a paid subscription, you will get better-analyzed info and data.
Messari has a news and research section where you will find current trends and studies. With the information, you will be able to decide better.
Visit messari

fiatleak – If you are looking for alive animated conversions of bitcoin, fiat leak is for you. you will see transactions in different currencies moving to the respective regions. You can see which area of the world is using cryptocurrency and how often.
visit fiatleak
Finally, the Price of Bitcoin Graph
The price of the bitcoin graph sits at $55k in march 2021. The price of the bitcoin had volatility and had seen days of a bubble even in a matter of days. And in the middle of the inflation, in 2020 the currency got attention, and the possibility of escaping another economic collapse, especially in the US.
Many people turned to the currency, mining and buying the currency. The buying power of the dollar is in question, while the need for bitcoin is on the verge of making hundreds of percent increase in 2021. Even if the reward of mining has decreased due to the halving algorithm and the number of miners in the industry, it does not seem to hold the process back. Many are still engaged in the process, making possible the growth of the currency.
On the other hand, bitcoin is getting attention from large retailers and manufacturers. Tesla bought billions of worth of bitcoin for car sale transactions. Banks in the US engaged in ways to use the coin as part of their transaction. Stores also already began accepting the coin. The BTMs in malls sell and buy bitcoin.
In the process, the price of the bitcoin graph is increasing making passing the $60k mark in 2021. In the coming few years, many have predicted that the price would go up to $100k and even more.